Grafana
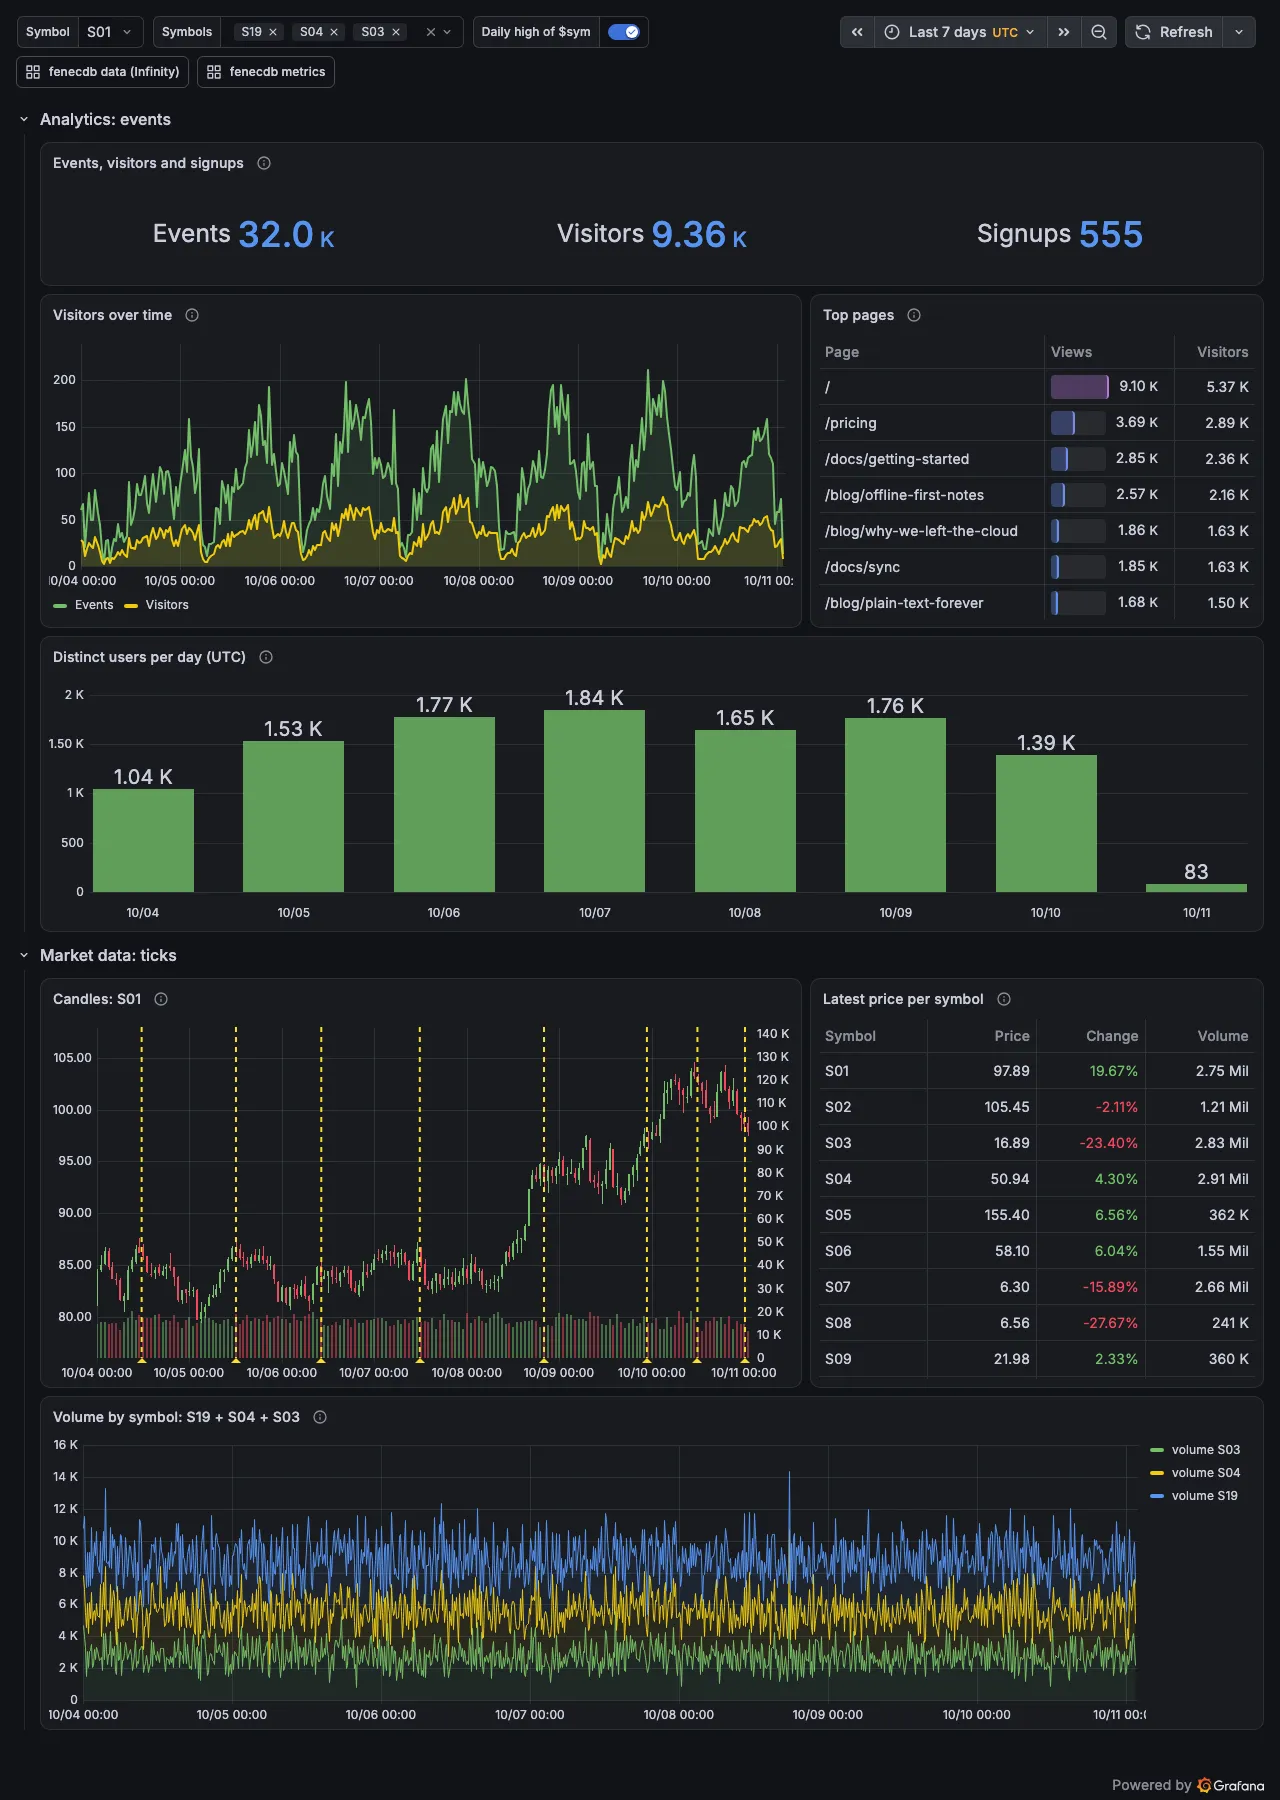
Grafana shows fenecdb two ways: the server's health
through Prometheus, and the data itself — visitors, top pages, price
candles — through fenecdb's own data source, each panel one FenecQL
statement with the dashboard's range and variables bound as parameters,
alert rules included. The repository's monitoring/ runs all of
it with one docker compose up.
Metrics and data
The dashboards read different things, by different paths, with different tokens.
| The server's metrics | The data | |
|---|---|---|
| What | statements, latency, memory, replication, tenants: /_metrics | your collections' rows, grouped and counted by FenecQL |
| Path | fenec-server → Prometheus → Grafana | Grafana → fenecdb-datasource → POST /query |
| Dashboard | monitoring/grafana/fenecdb.json | monitoring/grafana/fenecdb-data-plugin.json, and fenecdb-data.json through Infinity |
| Token | the admin token, in Prometheus | a JSON Web Token that reads two collections, in the data source |
| Docs | Monitoring | this page |
Run it
FENEC_HTTP_TOKEN=secret FENEC_METRICS_TOKEN=scrape \
FENEC_JWT_SECRET=$(openssl rand -hex 32) \
  docker compose -f monitoring/docker-compose.yml up -d --build
# the data:     http://127.0.0.1:3000/d/fenecdb-data-plugin
# the metrics:  http://127.0.0.1:3000/d/fenecdb

# down, the data and the token with it
docker compose -f monitoring/docker-compose.yml down -v- Seeded data. The first start writes thirty days of a product site's events, made by the traffic simulator of examples/analytics, and a week of trades in twenty invented symbols, 60 000 a day: about 108 000 events and 470 000 trades, written in two seconds.
- Grafana 13.2.2 with the plugin built from the checkout
(
integrations/grafana/Dockerfile: webpack for its frontend, mage for its backend), unsigned and let in by name; the Infinity plugin 4.1.1 beside it. The first build took 1 min 25 s on an M1 Air. - No code in fenecdb's server. Both data sources speak the HTTP endpoint every client speaks; the plugin through the Go SDK.
Details
The compose file starts fenec-server with a --policy, a
one-shot seed container (Node, running
monitoring/seed/seed.mjs with no install: Node strips the
simulator's types as it imports it), Prometheus, and Grafana once the seed
has finished. The seed makes events and ticks only
where they are missing, so a restart keeps the data, and mints the token
Grafana reads with each time it runs. Provisioning loads the three
dashboards, both data sources and the alert rule
(grafana/provisioning/).
The JWT secret goes to the server as a file
(--jwt-secret-file, from a compose secret) and not as
FENEC_JWT_SECRET, which every process in the container would
see; the seed reads the same file to mint Grafana's token. FENEC_PORT,
GRAFANA_PORT and PROMETHEUS_PORT move the ports
published on loopback.
Into a Grafana of your own, the same three pieces:
- The plugin: build it (
integrations/grafana/README.md:npm run build, then mage for your Grafana's platform), copydist/to<plugins>/fenecdb-datasource/, and setGF_PLUGINS_ALLOW_LOADING_UNSIGNED_PLUGINS=fenecdb-datasourceuntil it is signed (the README says how). - A token for a role the policy lets read (below):
fenec-server --jwt-secret-file jwt.secret --mint-token
    '{"sub":"grafana","role":"grafana","exp":1823000000}'
. - The data source:
monitoring/grafana/provisioning/datasources/fenecdb-plugin.ymlwith your server's URL and the token, then the dashboard's JSON imported.
apiVersion: 1
datasources:
  - name: fenecdb
    type: fenecdb-datasource
    uid: fenecdb
    url: http://fenecdb:8080
    jsonData:
      tenant: acme          # optional: requests go to /t/acme/
    secureJsonData:
      token: $__file{/run/fenec/grafana.jwt}
A panel's query
A panel's query is FenecQL. Grafana's range and interval, and the
dashboard's variables, are named in it; the plugin's backend makes each
name a $n parameter and sends the statement with the values
beside it, never in its text.
get ticks select bucket(at, $__interval_ms) as time, sym, sum(qty) as volume
  where sym in $syms and at >= $__from and at < $__to
group time, sym order time{"query": "get ticks select bucket(at, $1) as time, sym, sum(qty) as volume where sym in [$2, $3, $4] and at >= $5 and at < $6 group time, sym order time",
"params": [900000, "S19", "S04", "S03", 1791072000000, 1791683333856]}$__fromand$__toare the range in epoch milliseconds, which a timestamp field compares with as it is;$__interval_msis the interval Grafana picks for the panel's width, whichbuckettakes as milliseconds;$__max_data_pointsits width in points, whichlimit $__max_data_pointsholds a series to. The backend works them out from the request, so an alert rule has them as a panel does.- A dashboard variable is
$symor${sym}, a text;${n:int}reads it asnumber,int,float,bool,timestamporjson. A name used twice is one parameter. - A multi-value variable goes after
in:sym in $symsis sent assym in [$2, $3, $4], a parameter a value, since FenecQL'sintakes a list of values and a parameter binds one. Nothing picked isin [], no rows. - The columns come in the select list's order, typed: numbers,
times, text, JSON, a
geopoint as its longitude and latitude. No transformation between the answer and the panel. - A time series when the statement groups by its first column, a time — or when the editor's format says so. Text columns beside it are labels, so a group by time and symbol is a series a symbol.
Details
The editor colours FenecQL by the docs' own rules (the same file as
fenec studio's editor), completes $__from and the dashboard's
variables, and under Explain shows the statement as the backend binds
it, its parameters, and the server's plan. Beside the text it holds a list
of parameters, $1, $2, ...: each a literal of its
type, or one variable whole; names in the text are numbered after it.
The answer carries no types — a float written whole is 12,
a time is ISO text — so a column is typed by the collection's schema where
it is one of its fields (the collections statement, kept 30 s)
and by its values where it is computed: a text in the server's form of a
time is a time. An int past 253 stays exact; a vector or a sparse
vector is left out with a notice, as a panel cannot draw it and it can be
thousands of numbers a row. facet's counts are frames of their
own; a lookup is flattened as every flat transport flattens
it, one row per path under <collection>.<field>.
Annotations come from a query's time, title,
text and tags columns — the dashboard marks each
day's high of the picked symbol on its candles, last(at by px) as
time, max(px) as text — and a query variable takes its first column,
or __text and __value. Several queries of one panel
go as one read-only /batch, which the server answers at one
change; one that fails it is answered with its refusal and the rest are
asked on their own.
The data source runs reads: a statement starting with anything but
get, select or explain is refused
before it leaves Grafana. A refusal reaches the panel with the server's
status and message: a parse error's position, a 412 of an unmet
require, a 401 for the token.
The dashboard's statements
Every panel aggregates on the server, so Grafana is sent the points it draws and not the rows behind them; the recipes are Analytics and market data's.
-- Events, visitors and signups
get events select count(*) as Events, count(distinct user) as Visitors, sum(case when name = "signup_completed" then 1 else 0 end) as Signups where at >= $__from and at < $__to
-- Visitors over time
get events select bucket(at, $__interval_ms) as Time, count(*) as Events, count(distinct user) as Visitors where at >= $__from and at < $__to group Time order Time
-- Top pages
get events select path as Page, count(*) as Views, count(distinct user) as Visitors where name = "pageview" and at >= $__from and at < $__to group Page order Views desc limit 10
-- Distinct users per day
get events select bucket(at, 1d) as Day, count(distinct user) as Users where at >= $__from and at < $__to group Day order Day
-- The symbol variable, and the symbols, most traded first
get ticks select sym, count(*) as trades group sym order sym
get ticks select sym, sum(qty) as volume group sym order volume desc
-- Candles of $sym, and each day's high of it as annotations
get ticks select bucket(at, $__interval_ms) as Time, first(px by at) as open, max(px) as high, min(px) as low, last(px by at) as close, sum(qty) as volume where sym = $sym and at >= $__from and at < $__to group Time order Time
get ticks select last(at by px) as time, max(px) as text, bucket(at, 1d) as day where sym = $sym and at >= $__from and at < $__to group day order day
-- Latest price per symbol
get ticks select sym as Symbol, last(px by at) as Price, (last(px by at) - first(px by at)) / first(px by at) * 100 as Change, sum(qty) as Volume where at >= $__from and at < $__to group Symbol order Symbol
-- Volume by symbol: a series each
get ticks select bucket(at, $__interval_ms) as Time, sym, sum(qty) as volume where sym in $syms and at >= $__from and at < $__to group Time, sym order Time
Alert rules
A rule runs its query in Grafana's backend, with no browser to fill in a value, so it needs a data source that binds them itself. The compose provisions one over the trades: the last ten minutes' volume of each symbol, firing above 2 000.
# monitoring/grafana/provisioning/alerting/fenecdb.yml (its query)
datasourceUid: fenecdb
relativeTimeRange: {from: 21600, to: 0}
model:
  format: time_series
  intervalMs: 600000
  queryText: >-
    get ticks select bucket(at, $__interval_ms) as time, sym, sum(qty) as volume
where at >= $__from and at < $__to group time, sym order time- An instance a symbol, labelled
sym=S01, ...: the group by time and symbol is a series a symbol, which the rule's reduce and threshold take one at a time. - The rule's range and interval are bound as a panel's are: the plugin reads them off the request Grafana's backend makes.
- A dashboard variable has no value in a rule, and a query naming one is refused saying so rather than run without it.
Refreshes
The plugin keeps the answer to each statement and its parameters with
its ETag, and sends the same request again with
If-None-Match: a 304 is answered from the kept answer
(Polling a read).
Over the seeded week, the median of 21 runs of each, the ways in turns,
from the host into Docker on an M1 Air: fenec-server directly, Grafana
through Infinity, Grafana through the plugin with a new answer each time
(the range's end moved a millisecond a run, as a refresh's now
moves), and the same request again, answered 304 — with the read-only JWT
and with the server's token.
| Panel | Direct | Infinity | Plugin | Plugin, 304, JWT | Plugin, 304, server token |
|---|---|---|---|---|---|
| Events, visitors and signups | 10.1 ms | 14.7 ms | 14.5 ms | 14.0 ms | 4.9 ms |
| Visitors over time | 8.2 ms | 15.6 ms | 12.2 ms | 11.4 ms | 4.8 ms |
| Top pages | 11.7 ms | 14.6 ms | 13.6 ms | 13.4 ms | 2.9 ms |
| Distinct users per day | 7.6 ms | 10.5 ms | 9.6 ms | 9.3 ms | 2.8 ms |
| Candles, a symbol | 9.9 ms | 17.8 ms | 13.2 ms | 13.0 ms | 4.2 ms |
| Latest price per symbol | 79.8 ms | 83.1 ms | 82.4 ms | 82.3 ms | 3.0 ms |
| Volume by symbol, three | — | — | 10.9 ms | 11.0 ms | 3.9 ms |
- The plugin adds 2 to 5 ms a panel over the direct request, Infinity 3 to 8.
- With the server's token a 304 runs nothing: the server answers it from its change counter while nothing the statement reads was written, 3 to 5 ms whatever the statement.
- With a scoped token it runs the statement and compares a digest of the answer, which saves the transfer and the plugin's parsing only: a 304 by the counter would tell the token when anyone wrote to what it reads.
- A range ending at
nowis a new request every refresh. A variable's query, an absolute range, or one rounded (now/h) ask the same one again. Grafana's own query caching is Grafana Enterprise's and Cloud's, not the open-source build's.
node monitoring/grafana/bench.mjs measures it against a
running stack.
The plugin or Infinity
The Infinity plugin reads fenecdb with nothing to build or install
beyond Grafana's catalog; monitoring/ keeps its dashboard
(/d/fenecdb-data) beside the plugin's.
| fenecdb-datasource | Infinity 4.1.1 | |
|---|---|---|
| Install | built from integrations/grafana, unsigned until you sign it | Grafana's catalog, signed |
| A query | FenecQL in an editor that colours it | a JSON body, FenecQL inside a string |
| Values | bound as parameters by the backend | written into the body's text by Grafana's frontend |
| Multi-value variables | in $syms, a parameter a value | a list in one parameter (:json), which in does not take |
| Columns | the select list's order, typed from the schema and the values | sorted by name; an Organize transformation and a type a column, by hand, in each panel |
| Time series | a series a label (long to wide) | each number column a series, no labels |
| Alert rules | the range, the interval | the range alone; $__interval_ms written into the body by hand |
| Annotations, query variables | yes | yes |
| A refresh unchanged | a 304, the kept answer | the statement runs again |
| Where a request goes | the configured URL and the plugin's paths; no redirect followed | allowedHosts holds it to POST /query |
| Writes | refused before they leave Grafana; the token's policy on the server | the token's policy |
Infinity's configuration and its limits
Each panel posts a JSON body to /query: type JSON, parser
Backend, source URL, method POST, URL /query, body raw
application/json, and a column for each item of the select
list — timestamp for a time, number,
string. Grafana's range and interval go in as
${__from}, ${__to} and
$__interval_ms, and a text variable as
${sym:doublequote}, with no quotes around it.
{
  "query": "get ticks select bucket(at, $4) as t, first(px by at) as open, max(px) as high, min(px) as low, last(px by at) as close, sum(qty) as volume where sym = $3 and at >= $1 and at < $2 group t order t",
  "params": [${__from}, ${__to}, ${sym:doublequote}, $__interval_ms]
}
apiVersion: 1
datasources:
- name: fenecdb data
type: yesoreyeram-infinity-datasource
uid: fenecdb-data
url: http://fenecdb:8080
jsonData:
auth_method: bearerToken
allowedHosts:
- http://fenecdb:8080/query
secureJsonData:
bearerToken: $__file{/run/fenec/grafana.jwt}- Grafana writes variables into the body as text before it sends
it.
:doublequoteputs quotes around the value and a backslash before each"in it;"${sym}"leaves a"free to end the string, and${sym:json}writes a single value as it is. The format leaves a backslash as it is, so a value holding\"does end its string: keep a text variable the body's last string, and what follows can only make a body that is not JSON, which fenec-server refuses with 400. - Columns come back in the order of their names, so each panel has Grafana's Organize fields transformation put them back.
- Alerting needs the backend parser, and a body that names its
values: a rule's query runs where nothing writes
$__interval_msor a dashboard variable, and Infinity's frontend parsers cannot alert. - A refresh runs every statement again: Infinity keeps no
ETag, and runs its own filters and computed columns over every row the answer holds — aggregate in FenecQL. allowedHostsholds every query's URL toPOST /query, host and path: through the data source,/_whoamiis refused by the plugin.
The read-only token
Both data sources read with a JSON Web Token whose role the server's policy lets read two collections and write nothing.
# monitoring/policy.txt
events          read                   for grafana
ticks read for grafana- It decides what a Grafana user reads. Any viewer can send a
data source any query, through
POST /api/ds/query, whatever its dashboards say. Aput,setordelis 403, and so is a schema change or/_changes;/_metricsand the statement counts take no JSON Web Token at all, and a collection the policy does not name does not exist for it. - It is a secret of the data source, encrypted in Grafana's database and handed to the plugin's backend alone: in no dashboard JSON, query, inspector or page's settings.
- A variable is a value. Opened with a symbol written to close a string and send a statement of its own, the plugin sends it as one parameter and the candles show no data.
Details
A rule's filter narrows the rows further — events read where site
= $jwt.site for grafana — and is ANDed into every statement the token
sends, so a Grafana per customer sees its own rows
(Scoped access). The seed mints the
token for a year, and Grafana reads it from a file when it starts
($__file{} in the provisioning). To rotate one, mint another,
put it into the data source and restart Grafana; --jwt-max-age
on the server bounds how far ahead any token's exp may lie.
Checked end to end
make grafana-check starts monitoring/'s compose
on ports of its own and asks Grafana's /api/ds/query for every
panel's, variable's and annotation's query of both data dashboards, as a
viewer, holding each frame to the same FenecQL sent to fenec-server
directly — through the plugin, column by column in the select list's order,
the statement it sent included, and a series a label where it made one.
Then the alert rule must have evaluated, an instance a symbol, firing where
the server's rows say; and the refusals: a write, symbols written to close
their string, the token in no page's reach. CI runs it with the plugin's
own tests and its backend built for linux/amd64 and arm64.